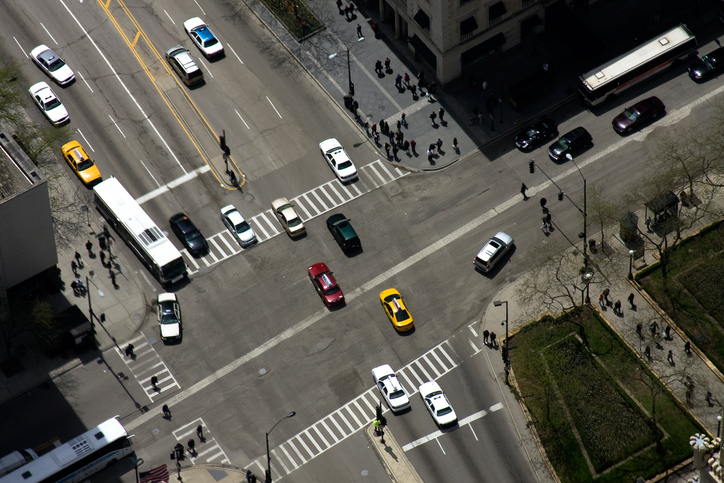
A new study shows the most dangerous intersections in California, above 10 or more accidents, based on motor vehicle collision data from 2015.
There were 444 total intersections ranked from the 435,000 compiled collision records, according to the data by Statewide Integrated Traffic Records System (SWITRS).
In total, there were 7,294 crashes, 7,478 injuries and 57 fatalities. The average number of accidents per dangerous intersection was 16.43 and for injuries it was 16.84.
The City of Sacramento had the second highest total number of dangerous intersections (13) trailing only Los Angeles (221), which is a noticeable difference.
Sacramento and Elk Grove had an intersection ranked in the top 50 - the City of Elk Grove's intersection of Calvine Rd. and Elk Grove Florin Rd. (No.45) and Sacramento city intersection of Los Robles Bl. and Marysville Bl. (No.47).
The No.1 dangerous intersection of Devonshire St. and Reseda Bl. in Los Angeles had a total score of 147 with 24 crashes and 41 injuries. The highest Sacramento area intersection of Calvine Rd. and Elk Grove Florin Rd. had a score of 91 with 19 crash and injuries 24.
Below is a ranking of only Sacramento intersections:
Other Sacramento cities number of intersections that are a part of the rankings were: The City of Elk Grove (4), Folsom (2), Rancho Cordova (2), Citrus Heights (2) and Orangevale (1).
Only 39 of the intersections in this study are located outside of Southern California.
Data visualization firm 1point21interactive, who collaborated with Estey and Bomberger personal injury firm, helped compile this list and Brian Beltz, the Content Manager and Research Lead of 1point21interactive, discussed the data.
"The data was for everything in California." said Beltz, project lead for this study. "It was interesting that Sacramento's top intersections were not located in the downtown area, they were more on the outskirts."
Beltz went on to talk about why they wanted to create this list.
"We wanted to get an overview of the issue." he said. "People aren't aware, so our next step is to talk to the cities on the next step."
The formula in how they scored each intersection was: Accident (x1) + Injury (x3) + Fatality (x10) = Overall Score.
The data was provided by the SWITRS (a multi-agency database maintained by the California Highway Patrol) to help create this list.


