If you're viewing on the ABC10 App, tap here for multimedia.
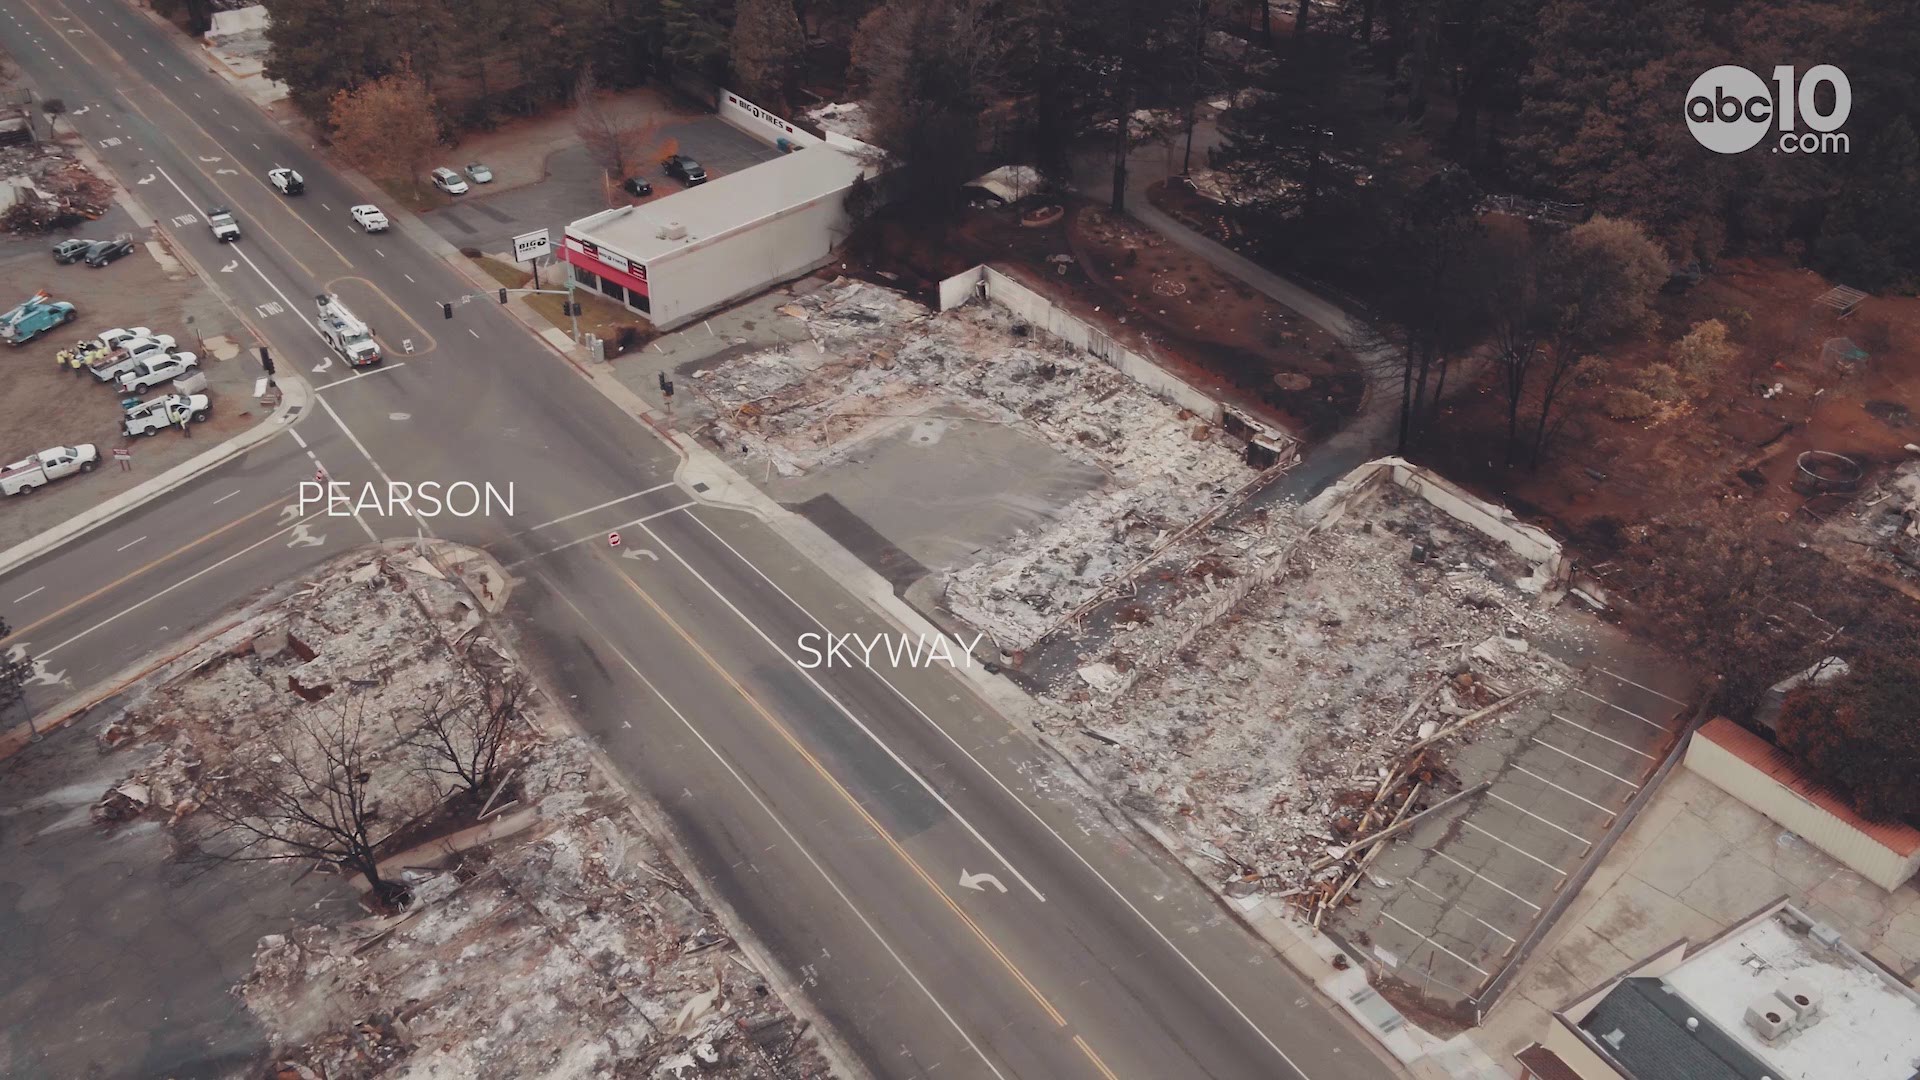
We have been hit by the one of the worst fire seasons in California history and now we brace for mud.
Heavy rain on a recently burned area is primed to slide and now we have a very detailed way to look at the areas of risk within a burn area.
California-based map and data company ESRI layered the risk from the US Geological Society over their maps so you can get a street-level look at some of the risk areas
Here are the maps below:
Global Landslide Risk with 2018 Fire Perimeters
This app uses NASA’s live “nowcast” data for landslides that considers projected precipitation and a suite of other factors to show live landslide susceptibility. To help people further understand how this relates to fires, they also added in the perimeters from 2018 fires.
USGS Debris Flow Risk Assessment for Burn Areas: Southern California
This app visualizes debris flow estimates for recent burn areas from the USGS. The map shows which parts of recent burn areas have low, moderate, or high risk for mudslides.
USGS Debris Flow Risk Assessment for Burn Areas: Northern California
This app visualizes debris flow estimates for recent burn areas from the USGS. The map shows which parts of recent burn areas have low, moderate, or high risk for mudslides.

