NORTH CAROLINA, USA — After no one won Saturday night, the Powerball jackpot now increases to $1.9 billion.
To help you out, we'll even the odds and give you a list of the luckiest numbers in Powerball history. These statistics are from 2015 up to Oct. 31, 2022.
Most common main numbers
According to lottonumbers.com, these are the most common numbers picked in the past. (Note: These are the white balls.)
- 61: Drawn 78 times
- 32: Drawn 77 times
- 63: Drawn 73 times
- 21: Drawn 73 times
- 69: Drawn 71 times
- 36: Drawn 70 times
- 23: Drawn 70 times
- 39: Drawn 69 times
- 62: Drawn 69 times
- 59: Drawn 68 times
Most common red ball numbers
These numbers had the most draws for the RED Powerball in recent years:
- 24: Drawn 45 times
- 18: Drawn 42 times
- 4: Drawn 36 times
- 13: Drawn 34 times
- 21: Drawn 34 times
- 10: Drawn 33 times
- 6: Drawn 33 times
- 26: Drawn 33 times
- 19: Drawn 32 times
- 3: Drawn 32 times
The "unluckiest" number
The unluckiest number is 34. It's been picked the least often. Since 2015, it has only been drawn 44 times. It was last drawn on Sept. 21, 2022.
Two are better than one
Since it's always best to have a pair, we'll look at the most common ones in Powerball history.
- 32 and 58-- drawn 12 times
- 8 and 27 -- drawn 11 times
- 7 and 15 -- drawn 11 times
- 36 and 61-- drawn 10 times
- 51 and 61-- drawn 10 times
More than one way to win!
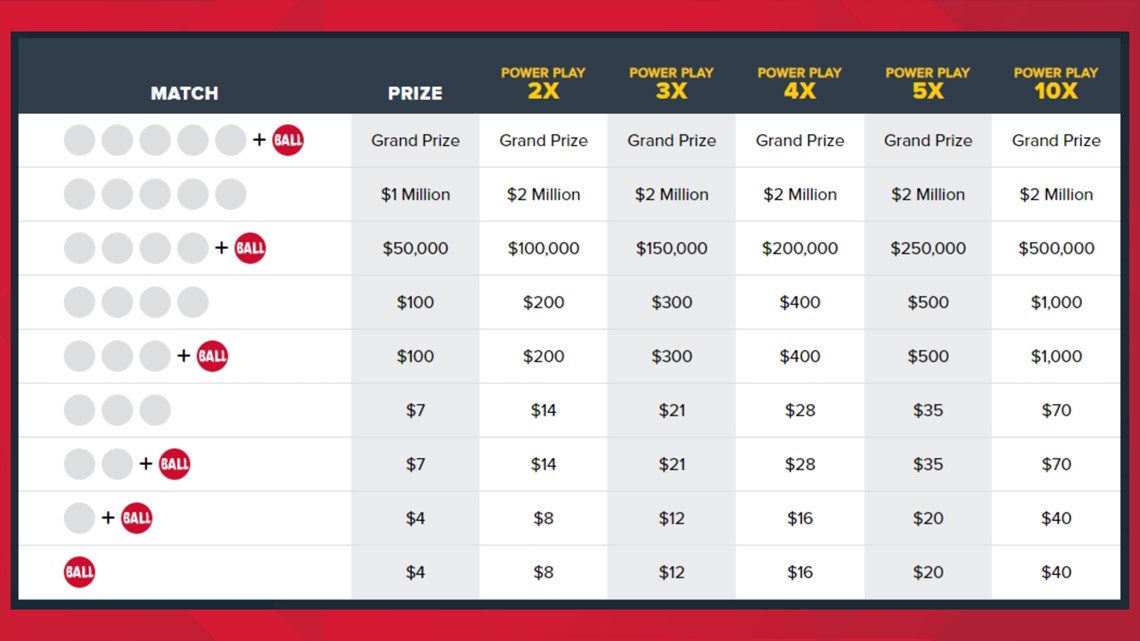
Even if you don't get all six numbers, you can still win. Here are some combinations that can lead you straight to the bank.


So there's a chance?
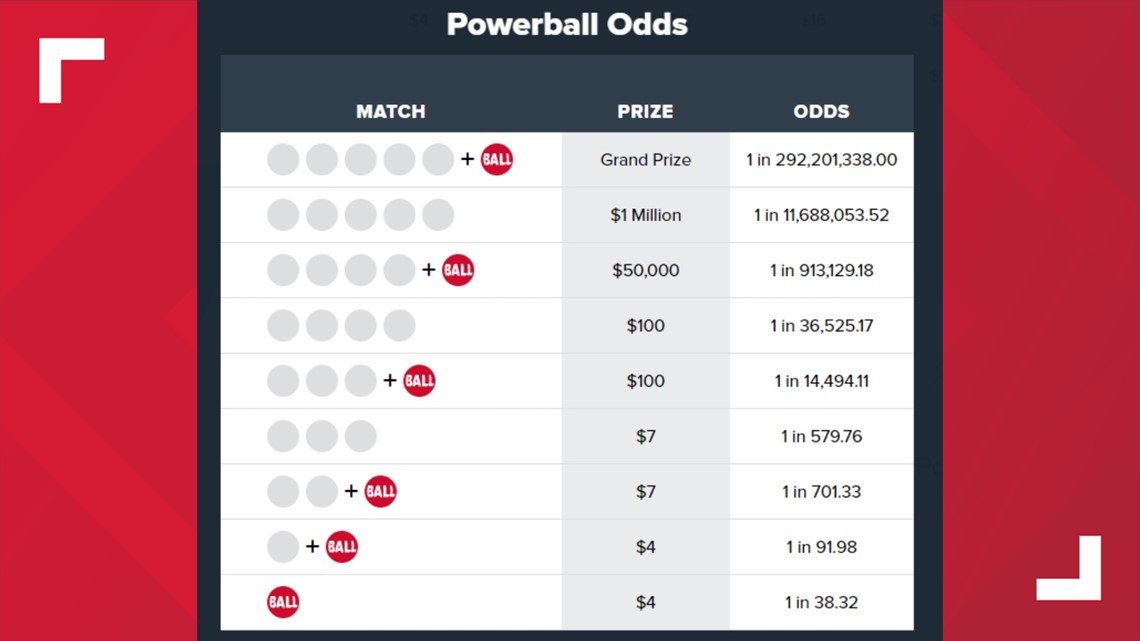
There's always a chance to win but it might only be $4 if you choose either the red ball OR the red ball and one white ball.
Still worth a shot? The choice is yours.
Check out the odds below for all the ways to match.


Powerball's 10 largest jackpots
1. $1.586 Billion – Jan. 13, 2016 (Prize shared by winners in CA, FL, TN)
2. $768.4 Million – March 27, 2019 (WI)
3. $758.7 Million – Aug. 23, 2017 (MA)
4. $731.1 Million – Jan. 20, 2021 (MD)
5. $699.8 Million – Oct. 4, 2021 (CA)
6. $687.8 Million – Oct. 27, 2018 (IA, NY)
7. $632.6 Million – Jan. 5, 2022 (CA, WI)
8. $590.5 Million – May 18, 2013 (FL)
9. $587.5 Million – Nov. 28, 2012 (AZ, MO)
10. $564.1 Million – Feb. 11, 2015 (NC, PR, TX)

