SACRAMENTO, Calif. — A new year is a fresh start in so many ways and for weather observations, it means a new year to calculate rain and snow totals.
Most cities in the United States use a specific location to record and collect weather statistics like the high temperature, low temperature and how much rain fell in a bucket that day. Over the years, you can get and average, then calculate following years to see if you are above or below the average. This can help determine droughts or floods, and helps give a broader understanding of each area's climate and expectations.
The most common way to calculate rain in an area is to measure the depth of rain that fell in a bucket, record it, and start over. Records begin on the first day of the year and end on the last.
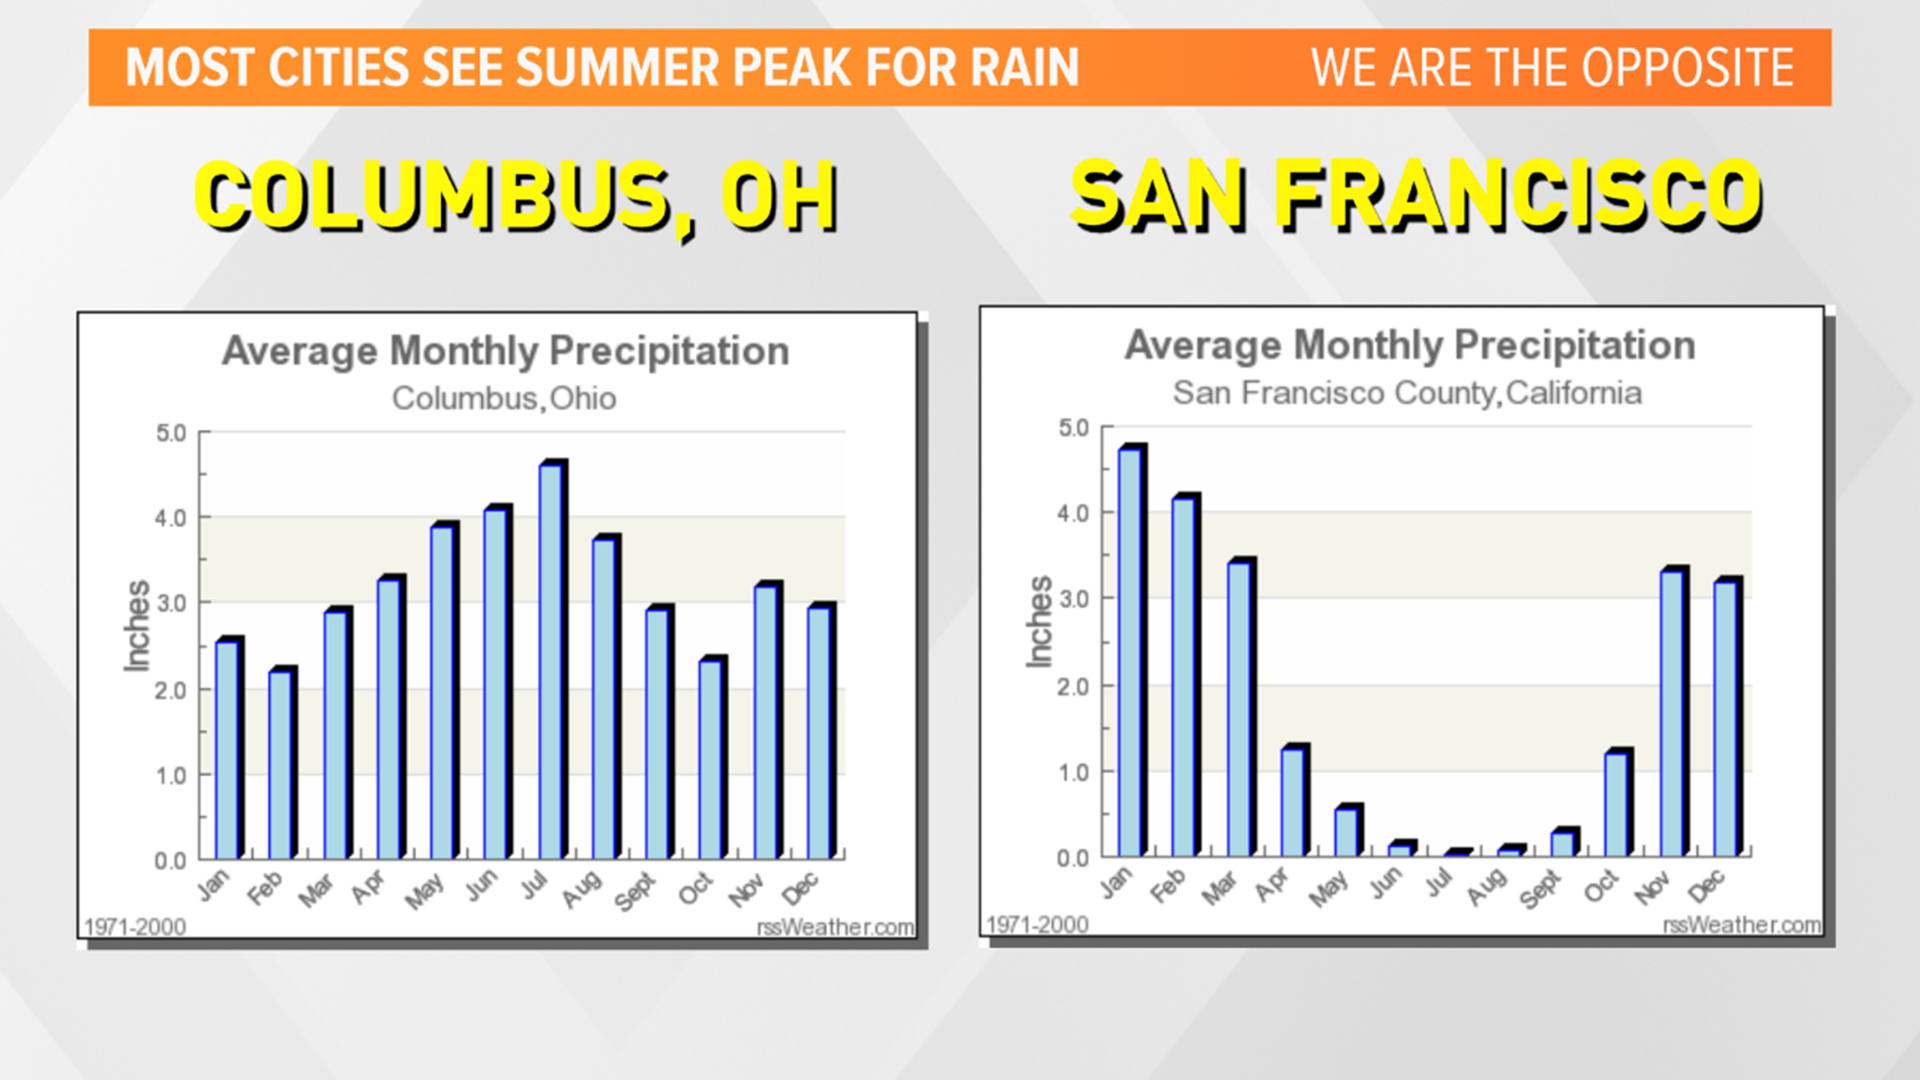
California weather stations do this, but they also keep another record to help better understand how the rainy season unfolded. The period of record most helpful for California is October 1 of any given year to the following September 30th of the next year. This covers the vast majority of time that rain will occur.
In fact, most rain falls between October and the following May, a narrow six month period. Rain can and will fall outside of those months, but its often statistically insignificant.
Until recently, the record period was July to the end of the following June, but officials with the National Weather Service moved the period of record to October to September to better reflect many water resource agencies time period. Using an alternate set of dates helps avoid misunderstanding a rainy season as being really wet or really dry.
For example, let's say you had a dry early part of the season with almost no rain until January. Then, a period of heavy rain fell in the winter and spring and the following fall and early winter was heavy, as well. If you took the January through December data, it would show a blockbuster season for California. However, if both years were lopsided with one half being wet, and the other dry over an October through September period, it might end up showing average years and a closer representation of reality.
So remember, in California the period of record reflects the season of rain to better help our understanding of our weather and climate.
RELATED CONTENT:
RAIN OR SHINE? GET THE LATEST FORECAST IN YOUR
NEIGHBORHOOD BY DOWNLOADING THE ABC10 APP:
►Get the forecast in your email! Sign up now for ABC10's Daily Blend Newsletter
WATCH MORE:


